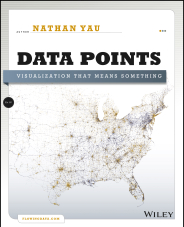
 Data Points: Visualization That Means Something
Wiley, April 2013
Reveal the story your data has to tell
To create effective data visualizations, you must be part statistician, part designer, and part storyteller. In his bestselling book Visualize This, Nathan Yau introduced you to the tools and programming techniques for visualization. Now, in Data Points, he explores the thinking process that helps you create original, meaningful visualizations that your audience will both understand and remember. Here's how to make your data mean something.
- Discover what data is and what you can learn from it
- Learn how to explore your data, find the story, and bring it to life
- Understand visualization as a medium that lets you present and express meaning in data
- Tap into your creative side and determine the most effective way to tell your story
- Compare tools for exploration and analysis
- Allow data, the story, and your goals to dictate visualization techniques with geometry, traditional charts, maps, color, art, and even humor
paperback | ISBN: 9781118462195 | Publication Date: April 2013


